


The Dow Jones Industrial Average (DJIA) stands as Wall Street’s most recognizable barometer, tracking 30 of America’s largest blue-chip companies and serving as the unofficial pulse of the U.S. economy. Created in 1896 by financial journalist Charles Dow, this price-weighted index has witnessed every major economic event of the past 128 years, from the Great Depression to the dot-com boom to the COVID-19 pandemic.
Understanding the DJIA isn’t just about following numbers—it’s about grasping how America’s corporate giants reflect broader economic trends. Whether you’re checking the djia today or analyzing the djia chart for investment decisions, this comprehensive guide will help you navigate everything from basic calculations to advanced investment strategies.
For those interested in exploring comprehensive financial planning strategies, the DJIA serves as a crucial benchmark for portfolio performance and market timing decisions.
Table of Contents
What Is the Dow Jones Industrial Average?
The Dow Jones Industrial Average is a stock market index that tracks 30 large, publicly traded companies listed on the New York Stock Exchange (NYSE) and Nasdaq. Unlike market-cap-weighted indices, the DJIA uses a unique price-weighted methodology, meaning companies with higher stock prices have greater influence on the index’s movements regardless of their actual market size.
S&P Dow Jones Indices currently manages the DJIA, maintaining its composition and overseeing the complex calculations that keep this historic index relevant in modern markets. The index serves multiple purposes: it acts as a quick economic health check, provides investment benchmarks, and offers insights into how America’s largest corporations are performing.
The Historical Foundation
Charles Dow and his business partner Edward Jones launched the DJIA with just 12 companies, primarily focused on industrial sectors like railroads, cotton, gas, sugar, tobacco, and oil. This industrial focus reflected America’s economic landscape in the late 1800s, when manufacturing and raw materials dominated the economy.
The index expanded to 20 components in 1916 and reached its current 30-stock composition in 1928. This structure has remained constant for nearly a century, though the individual companies have changed dramatically to reflect economic shifts and technological advancement.
For entrepreneurs looking to understand how modern business scaling strategies can impact market performance, the DJIA’s evolution provides valuable insights into long-term economic trends.
Understanding DJIA Calculation: The Dow Divisor Explained
The DJIA’s calculation methodology sets it apart from most modern indices. While the S&P 500 uses market capitalization weighting, the DJIA employs a price-weighted system with a crucial component called the Dow Divisor.
The Price-Weighted System
In a price-weighted index, companies with higher stock prices have more influence on the index’s movements. For example, if a $300 stock moves 1%, it affects the DJIA more than a 1% move in a $30 stock, even if the cheaper stock represents a larger company by market capitalization.
DJIA Price = Sum of All 30 Component Stock Prices ÷ Dow Divisor

The Dow Divisor: Maintaining Continuity
The Dow Divisor, currently approximately 0.15265312230608 (as of 2024), addresses the mathematical challenges created by stock splits, mergers, and component changes. Without this divisor, such corporate actions would create artificial jumps or drops in the index level.
When a company in the DJIA announces a stock split, S&P Dow Jones Indices adjusts the divisor to ensure the index level remains consistent. This mathematical precision maintains the DJIA’s historical integrity while accommodating the natural evolution of its component companies.
Business owners interested in understanding how digital transformation strategies can impact stock valuations will find the DJIA’s methodology particularly relevant for analyzing corporate performance metrics.
Current DJIA Components: America’s Blue-Chip Elite
The DJIA’s 30 components represent diverse sectors of the American economy, from technology giants to financial services leaders. These blue-chip companies are selected based on their reputation, sustained growth, and broad investor interest.
Major Technology Players
Companies like Apple (AAPL), Microsoft (MSFT), and the recently added NVIDIA Corporation (NVDA) represent the technology sector’s growing importance in the American economy. NVIDIA’s November 2024 addition, replacing Intel, reflects the artificial intelligence revolution’s impact on market valuations.
Financial Services Representation
JPMorgan Chase, Goldman Sachs, and American Express represent the financial sector, providing insights into banking and financial services performance. These companies often serve as economic indicators, as their performance closely correlates with overall economic health.
Consumer and Industrial Giants
Home Depot, Walmart, and Boeing represent consumer spending and industrial production. Their performance often reflects broader consumer confidence and manufacturing trends.
For those exploring small business opportunities, understanding how these large corporations operate provides valuable insights into successful business models and market positioning strategies.
DJIA Component Changes: Reflecting Economic Evolution
The DJIA’s composition has evolved significantly to maintain relevance in changing economic conditions. These changes, while infrequent, often signal major shifts in America’s economic landscape.
Recent Notable Changes
2024 Additions:
- Amazon.com Inc. (AMZN) replaced Walgreens Boots Alliance in February
- NVIDIA Corp. (NVDA) replaced Intel Corp. in November
- Sherwin-Williams (SHW) replaced Dow Inc.
These changes reflect the growing importance of e-commerce, artificial intelligence, and specialized industrial services in the modern economy.
Historical Transformations
The DJIA has undergone only 53 changes since its inception, highlighting the committee’s conservative approach to modifications. Each change typically reflects broader economic trends:
- The 1990s saw increased technology representation
- The 2000s brought financial services expansion
- The 2010s emphasized consumer technology and services
- The 2020s focus on digital transformation and AI
Understanding these patterns helps investors anticipate future economic trends and market opportunities for growth.
Historical Milestones: DJIA’s Journey Through Time
The DJIA has witnessed and recorded every major economic event in American history, creating a unique timeline of market psychology and economic performance.
Depression Era Volatility
March 15, 1933: The largest single-day percentage gain (15.34%) occurred during the Great Depression, demonstrating how extreme market conditions can create dramatic reversals.
Black Monday Crash
October 19, 1987: The DJIA fell 22.61% in a single day, marking one of the most significant market crashes in history. This event led to important regulatory changes and risk management improvements.
9/11 Impact
September 17, 2001: Following the terrorist attacks, the DJIA dropped 684.81 points (7.1%) on its first trading day, but recovered within months, demonstrating American market resilience.
Pandemic Response
March 2020: The COVID-19 pandemic created unprecedented volatility, with the DJIA experiencing multiple 1,000+ point swings in both directions before eventually reaching new highs by November 2020.
Recent Records
May 16, 2024: The DJIA surpassed 40,000 for the first time, reflecting strong corporate earnings and economic recovery.
These milestones provide valuable context for current market conditions and help investors understand how external events influence market behavior.
Investment Strategies: Accessing the DJIA
Individual investors cannot directly purchase the DJIA, but several investment vehicles provide exposure to its performance.
Exchange-Traded Funds (ETFs)
The SPDR Dow Jones Industrial Average ETF (DIA) is the most popular way to invest in the DJIA. This ETF:
- Tracks the DJIA’s performance
- Offers professional management
- Provides liquidity through exchange trading
- Charges low management fees
Index Funds
Several mutual fund companies offer DJIA index funds that:
- Provide automatic reinvestment of dividends
- Offer systematic investment plans
- Allow for retirement account contributions
- Include professional oversight
Individual Stock Selection
Advanced investors may choose to replicate the DJIA by purchasing individual component stocks, though this approach requires:
- Significant capital investment
- Regular rebalancing
- Transaction cost management
- Dividend reinvestment planning
For those interested in developing comprehensive investment strategies, understanding DJIA-based investment options provides a solid foundation for portfolio construction.
DJIA vs. S&P 500: Understanding the Differences
While both indices track American stock performance, their methodologies and compositions create distinct investment characteristics.
Composition Differences
| Feature | DJIA | S&P 500 |
|---|---|---|
| Number of Companies | 30 | 500 |
| Weighting Method | Price-weighted | Market-cap weighted |
| Selection Criteria | Committee-based | Formula-based |
| Sector Representation | Limited | Comprehensive |
| Rebalancing | As needed | Regular |
Performance Characteristics
The S&P 500 has historically outperformed the DJIA over longer periods due to:
- Broader diversification
- Market-cap weighting efficiency
- More representative sector allocation
- Regular rebalancing mechanisms
Investment Implications
DJIA Advantages:
- Focuses on established, profitable companies
- Provides exposure to dividend-paying stocks
- Offers historical continuity and recognition
- Emphasizes price momentum in high-value stocks
S&P 500 Advantages:
- Better represents overall market performance
- Includes growth companies across all sectors
- Provides more balanced risk distribution
- Reflects true market capitalization weights
Entrepreneurs exploring business scaling opportunities can benefit from understanding how these different methodologies reflect various aspects of corporate success and market dynamics.
Limitations and Criticisms of the DJIA
Despite its popularity and historical significance, the DJIA faces several legitimate criticisms from financial professionals and academics.
Price-Weighting Problems
The price-weighted methodology creates several issues:
- Higher-priced stocks have disproportionate influence regardless of company size
- Stock splits artificially reduce a company’s index impact
- Price movements don’t reflect true economic value changes
- Mathematical quirks can distort index performance
Limited Representation
With only 30 companies, the DJIA:
- Excludes many significant American corporations
- Overrepresents certain sectors while ignoring others
- Cannot capture the full scope of economic activity
- May miss emerging industry trends
Selection Bias
The committee-based selection process:
- Lacks transparent, objective criteria
- May reflect committee preferences rather than market realities
- Changes components infrequently, potentially missing important shifts
- Focuses on established companies, potentially missing growth opportunities
Comparison to Modern Alternatives
Financial professionals often prefer broader indices because they:
- Provide better diversification
- Use more sophisticated weighting methods
- Include more representative company selections
- Offer systematic rebalancing processes
Those interested in understanding how modern marketing strategies can help businesses achieve the scale necessary for index inclusion will find these limitations particularly relevant.
Trading the DJIA: Real-Time Market Data
Modern investors have unprecedented access to DJIA information through various platforms and tools.
Key Data Points
Real-Time Information:
- DJIA now: Current index level and daily changes
- DJIA live: Continuous updates during trading hours
- DJIA futures: Pre-market and after-hours trading indicators
- DJIA ticker: Streaming price and volume data
Technical Analysis Tools
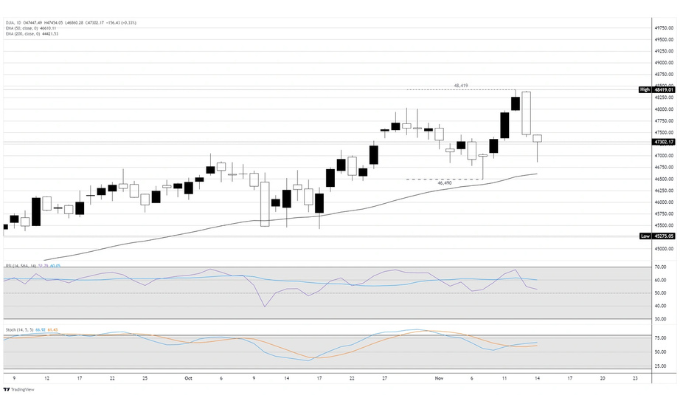
DJIA Chart Analysis:
- Historical price patterns and trends
- Support and resistance levels
- Volume indicators and momentum signals
- Comparative performance metrics
Market Timing Considerations
DJIA Today Performance Factors:
- Economic data releases
- Federal Reserve policy announcements
- Corporate earnings reports
- Geopolitical events and market sentiment
Understanding these data points helps investors make informed decisions about investment timing and portfolio allocation.
Global Impact and Economic Significance
The DJIA’s influence extends far beyond American markets, serving as a global economic indicator and investment benchmark.
International Market Influence
When the DJIA moves significantly:
- Asian markets often follow similar patterns
- European indices frequently correlate with DJIA movements
- Currency markets may respond to perceived economic strength changes
- Commodity prices can shift based on industrial demand expectations
Economic Policy Implications
Federal Reserve policymakers consider DJIA performance when:
- Evaluating monetary policy effectiveness
- Assessing economic recovery progress
- Determining interest rate adjustment timing
- Measuring financial market stability
Corporate Decision Making
DJIA component companies often:
- Time major announcements around market conditions
- Adjust capital allocation strategies based on market performance
- Consider index inclusion implications for strategic decisions
- Monitor relative performance against other index components
Business leaders exploring digital transformation opportunities can leverage DJIA trends to understand broader economic conditions affecting their strategic planning.
Future of the DJIA: Adapting to Modern Markets
As financial markets continue evolving, the DJIA faces pressure to maintain relevance while preserving its historical significance.
Potential Modernization Efforts
Methodology Updates:
- Consideration of market-cap weighting elements
- More frequent rebalancing possibilities
- Enhanced transparency in selection criteria
- Integration of ESG (Environmental, Social, Governance) factors
Technology Integration:
- Real-time calculation improvements
- Enhanced data distribution methods
- Mobile-first investor access
- Artificial intelligence-assisted component analysis
Emerging Sector Representation
Future DJIA changes may include:
- Additional technology companies reflecting AI advancement
- Renewable energy and sustainability leaders
- Biotechnology and healthcare innovation
- Financial technology (fintech) pioneers
Maintaining Historical Integrity
The challenge lies in balancing modernization with:
- Preserving 128 years of historical data continuity
- Maintaining investor recognition and trust
- Ensuring statistical validity across time periods
- Protecting the index’s role as an economic barometer
For entrepreneurs interested in innovative business models, understanding how established institutions like the DJIA adapt to change provides valuable insights for business evolution strategies.
Frequently Asked Questions
What does the DJIA measure exactly?
The DJIA measures the stock price performance of 30 large American companies, serving as a gauge for overall U.S. economic health and stock market sentiment. It tracks price movements rather than total market value, making it different from market-cap-weighted indices.
How often does the DJIA composition change?
DJIA changes are relatively rare, occurring only when necessary to maintain the index’s relevance. Since 1896, there have been only 53 modifications, with recent changes reflecting shifts toward technology and away from declining industries.
Can individual investors buy the DJIA directly?
No, investors cannot purchase the index directly. However, they can gain exposure through ETFs like DIA, index funds, or by purchasing individual component stocks in appropriate proportions.
Why is the DJIA price-weighted instead of market-cap-weighted?
The DJIA uses price weighting for historical reasons—it was simpler to calculate in 1896. While this methodology has limitations, changing it would break the historical continuity that makes the index valuable as a long-term economic indicator.
How does the Dow Divisor work?
The Dow Divisor adjusts for stock splits, mergers, and component changes to maintain index continuity. Currently around 0.153, it ensures that corporate actions don’t artificially inflate or deflate the index level.
What’s the difference between the DJIA and Nasdaq?
The DJIA is a 30-company index focusing on established blue-chip stocks, while the Nasdaq Composite includes over 3,000 companies, primarily technology-focused. The DJIA uses price weighting, while Nasdaq uses market-cap weighting.
How do DJIA futures work?
DJIA futures allow investors to bet on the index’s future direction and provide price discovery during non-trading hours. They’re particularly useful for hedging portfolios and gauging market sentiment before regular trading begins.
Building Your Investment Strategy Around the DJIA
The Dow Jones Industrial Average remains one of the most important financial benchmarks in global markets. While it has limitations, its historical significance, focus on established profitable companies, and role as an economic barometer make it valuable for investors and market observers.
Whether you’re tracking the djia stock price today, analyzing the djia chart for technical patterns, or considering djia futures for market timing, understanding this index’s mechanics and implications enhances your investment decision-making process.
The DJIA’s journey from a 12-stock industrial average to today’s 30-component benchmark reflects America’s economic evolution. As markets continue modernizing, the index will likely adapt while maintaining its core mission: providing a reliable measure of how America’s largest, most established companies perform in changing economic conditions.
For investors seeking exposure to America’s corporate giants, the DJIA offers a time-tested approach to blue-chip investing. Combined with broader market indices and individual research, it can play a valuable role in diversified investment strategies focused on long-term wealth building and economic participation.
Those interested in learning more about comprehensive financial planning approaches can use DJIA performance as one component of broader investment analysis and decision-making processes.